

chart下载地址
https://gkarthiks.github.io/helm-charts/charts/prometheus-kafka-exporter/
下载chart
$ helm repo add gkarthiks https://gkarthiks.github.io/helm-charts
$ helm fetch gkarthiks/prometheus-kafka-exporter
修改values文件
    rbac:
      create: true
      pspEnabled: true
    serviceAccount:
      create: true
      name:
    replicaCount: 1
    image:
      repository: danielqsj/kafka-exporter
      tag: latest
      pullPolicy: IfNotPresent
    kafkaServer:
      - kafka-test-headless:9092
    service:
      type: ClusterIP
      port: 9308
      annotations:
        prometheus.io/scrape: "true"
    resources:
       limits:
        cpu: 100m
        memory: 128Mi
       requests:
        cpu: 100m
        memory: 128Mi
    nodeSelector:
      apptype: monitoring
    tolerations: []
    affinity: {}
部署,注意要和kafka在同一namespace下
helm install --name kafka-exporter gkarthiks/prometheus-kafka-exporter --namespace monitoring -f ./prometheus-kafka-exporter/values.yaml
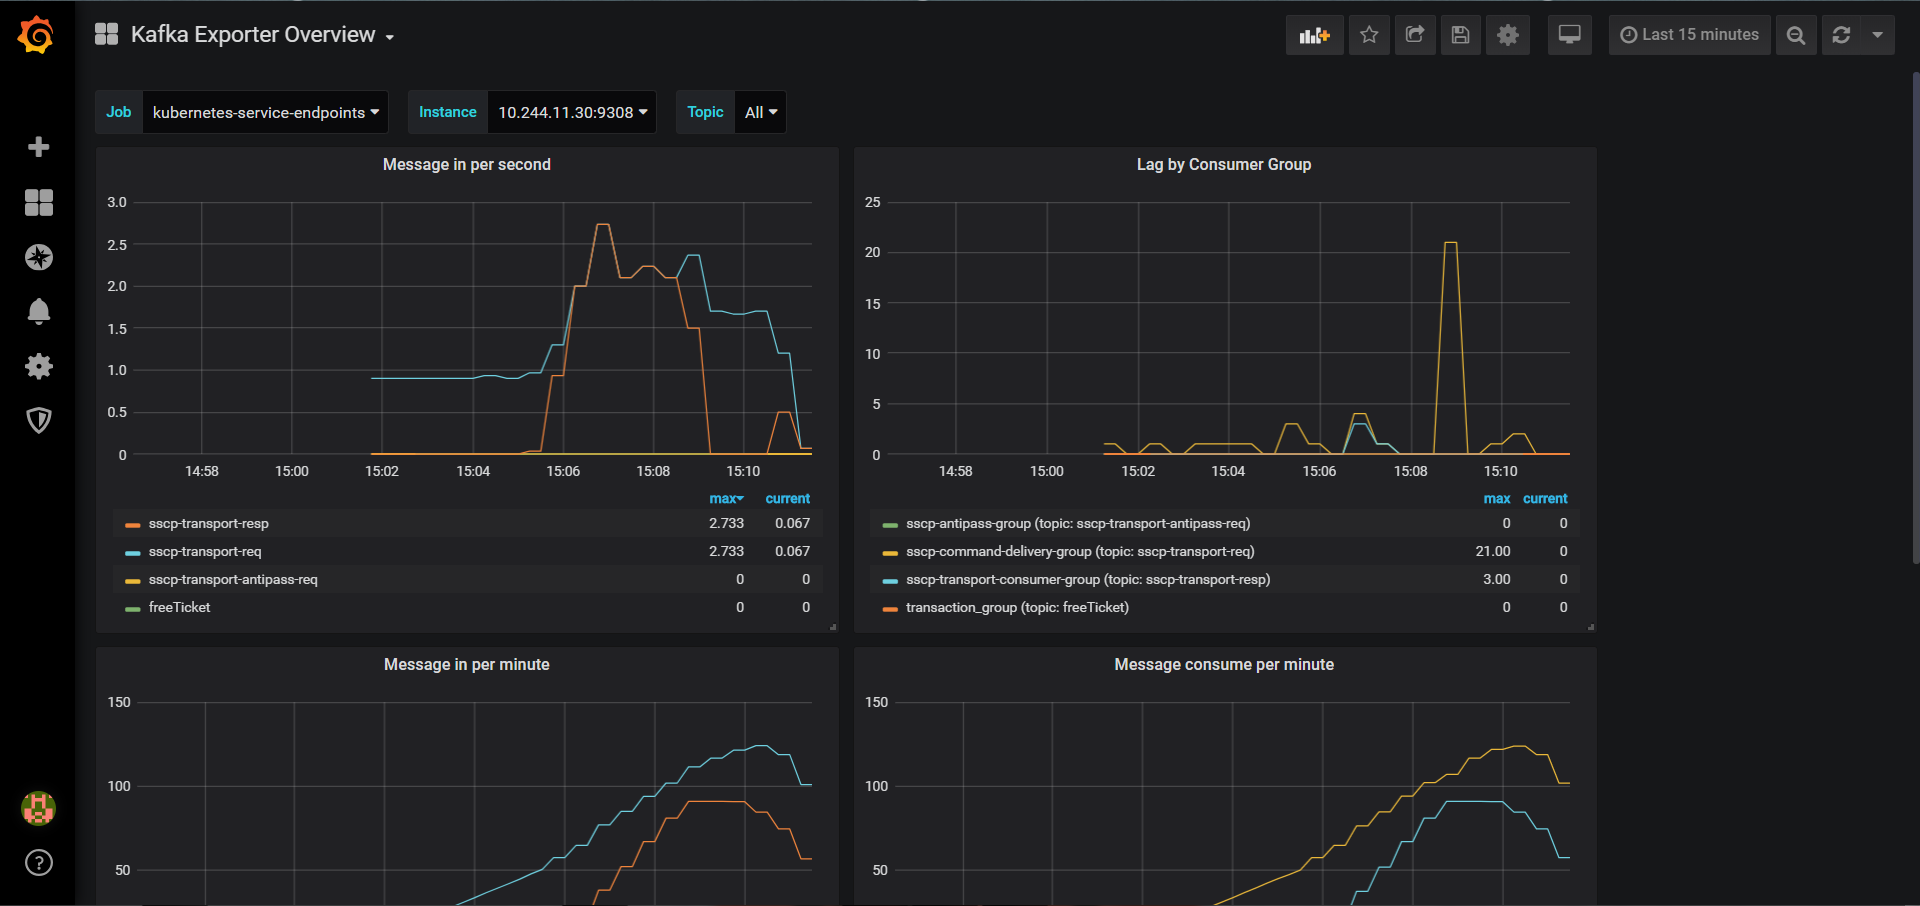
grafana
https://grafana.com/grafana/dashboards/7589
原文来自:https://www.bbsmax.com/A/nAJv1kjozr/
本文地址:https://www.linuxprobe.com/prometheus-kafka-exporter.html编辑:向云艳,审核员:逄增宝
Linux命令大全:https://www.linuxcool.com/
Linux系统大全:https://www.linuxdown.com/
红帽认证RHCE考试心得:https://www.rhce.net/